sábado, 29 de mayo de 2010

Peñoles (Pe&oles*) Dalayed near tripe support in MXN$230

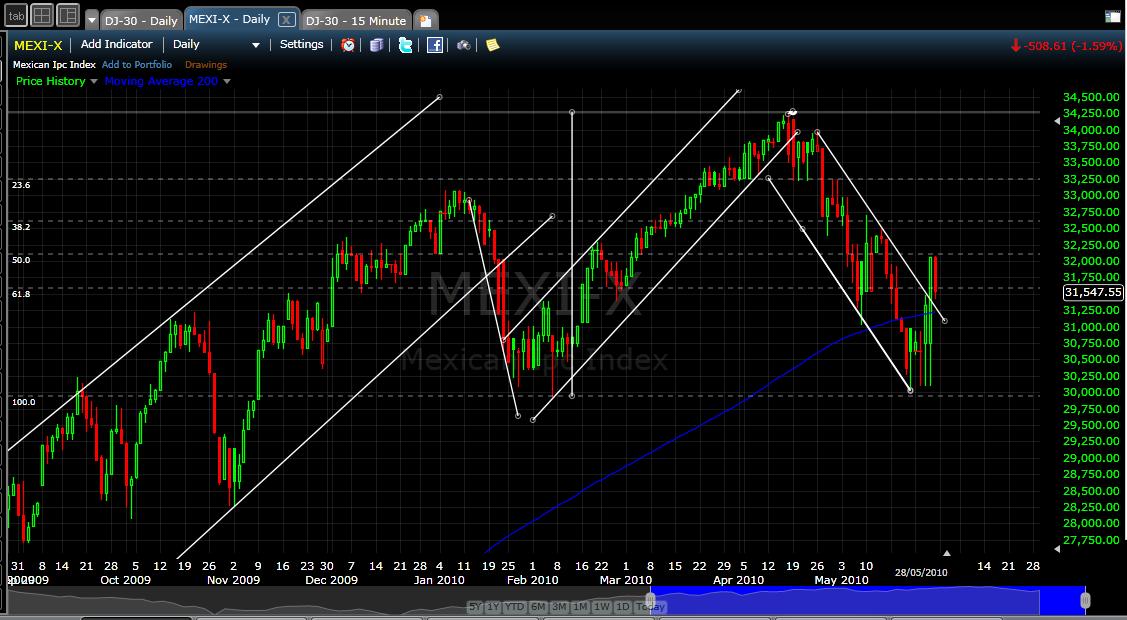
While the IPC (Index of Price and Quotes) presents an adjustment of 7.8% at end-May. While Peñoles (Pe&oles*) presents a decline of 13.6%.

The chart indicates a delay to the market (IPC) and a delay with the increase of gold. This is the company more linked to the gold.

Technically is posible a technical bounce:
a) MACD is crossing the moving average, then will be a sign of buy.
b) The Stochastic indicates oversold, but with trend to buy.
c) The relative strength index RSI is on the rise and has room to rise.
d) Is moving in a bear channel, that can be broken.

Technical support at MXN$ 235.00
Technical resistance at MXN$ 265.00

Observe:
a) Breaking if the bear channel.
b) Validate the MACD break upward of its moving average.
c) Yield from the current price (MXN$241.8) to its resistance (MXN$265) is 9.6%.


GEO (GEOB) Stable, interesting and boring.

While the IPC (Index of Price and Quotes) presents an adjustment of 7.8% at end-May. GEO (GEOB) has a similar adjustment.

The chart indicates a movement in a slightly upward channel without major shocks.

Technically is in good time:
a) MACD could cross the moving average, then will be a sign of buy.
b) The Stochastic appears neutral, but with trend to buy.
c) The relative strength index RSI is on the rise and has room to rise.
d) Is facing an important resistance at MXN$ 37.00.
e) With the rise of the market could overcome the resistance and search for the roof of the channel.

Technical support at MXN$ 34.00
Technical resistance at MXN$ 37.00

Observe:
a) Overcome the resistance.
b) Indicator MACD crossing its moving average upward.
c) Yield from the current price (MXN$ 36.00) to the roof of the channel (MXN$ 40.00) 11%.


Alfa (AlfaA) Solid, stable and delayed.

While the IPC (Index of Price and Quotes) presents an adjustment of 7.8% at end-May. While Alfa (AlfaA) presents a decline of 11%.

The chart indicates a long-term sustained growth, fairly stable (low volatility).

Technically is in time for a technical bounce:
a) MACD could cross the moving average, then will be a sign of buy.
b) The Stochastic indicates oversold, but with trend to buy.
c) The relative strength index RSI is on the rise and has room to rise.
d) Is moving in a bear channel, that can be broken.

Technical support at MXN$ 87.00
Technical resistance at MXN$ 97.00

Observe:
a) Breaking if the bear channel.
b) Indicator MACD crossing its moving average upward.
c) Yield from the current price to its resistance is 8%.


Elektra (Elektra*) Very delayed.

While the IPC (Index of Price and Quotes) presents an adjustment of 7.8% at end-May. While Elektra presents a decline of 23%.

The chart indicates a high volatility paper. Also the weakness he has shown during this year.

But technically is in time for a technical bounce:
  1. MACD is about to cross the moving average, a sign of buy.
  2. The Stochastic indicates oversold.
  3. The relative strength index RSI is on the rise and has room to rise.
  4. The dynamic resistance is broken, on Tuesday.
Technical support at MXN$ 490.00
Technical resistance at MXN$ 580.00

Observe MACD validation in the coming days.
Yield from the current price (MXN$513.55) to its resistance (MXN$580.00) is 12.9%.


Naftrac. Gateway to Mexico Market.

The easiest way to invest in the stock market in Mexico is through NAFTRAC.

The iShares ETF NAFTRAC seeks investment results that correspond to the Price and Quotations Index (IPC), before fees and costs. This index comprises the 35 largest issuers of the Mexican stock market based on capitalization value.

The benchmark IPC is the leading indicator of stock market activity in Mexico is highly representative and reliable.

A foreign investor seeking or having to invest in Mexico, in a simple way and representative of the market, your best alternative is NAFTRAC.

Subsequently interesting comment on specific stations for speculation.

http://mx.ishares.com/product_info/fund/overview/NAFTRAC.htm

viernes, 28 de mayo de 2010

Black May

Before a long weekend. (On Monday rests NYSE)

May DJI closed with losses of 7.9% and the IPC 3.5%. 

The decline in the DJI for the month of May only have been worse in 1940 (-21.7%), 1932 (-20.3%), 1931 (-15%) and 1915 (-9.9%). In these years the annual return of the DJI was negative, except 1915. 

The DJI performance this year has been negative. Historically when this happens in 83% of cases the DJI annual performance (return) is negative. 

On the positive side, in January the New Orleans Saints won the Superbowl. Being a National conference team predicts a bull market in 2010. 

Note. Remember that the Mexico Stock Market IPC is strongly linked to DJI in the medium and long term.

The markets, may 28th.

The U.S. market DJI respects the short-term bull chanel, as already stated. Today at 13:10 successfully tested the floor of the channel and again it did for the end of day. The DJI is moving upward with increasing maximums and minimums within a channel that has been respected. But it moves very close to his floor, this could be resolved in two ways: a rise or start a process of lateralization (which we have no sign still). 

For its part, the Mexican Stock Market, which as already stated, is closely linked to DJI, followed him in his losses. But the IPC made a pullback movement that led to validate the break of yesterday. This validation would give strength to the formation of a new trend and show a more stable market in the short term, with prospects for recovery. But for this on Monday will respect the floor marking. 

The fact of respect the levels of support is a positive sign. However, the market could not maintain their momentum, which is a sign of weakness. 

Fundamental driver: Today Fitch Ratings lower Spain’s sovereign debt rating from AAA to AA+, sparking fears (VIX in 33.6 +13.21%) and produce falling markets.

DJI graphic with sample frequency of 5 minutes.

IPC graphic with a daily basis. (The yesterday candle, May 27th, is incorrect drawn).

jueves, 27 de mayo de 2010

Mexico Stock Exchange (IPC) may 27th

The IPC Index (Index of Prices and Quotes) shows positive signs, as well as an accelerated recovery of the lost ground.

Today the IPC breaks the dynamic resistance that began from 26 April (red circle in the figure), when the market correction began. This resistance was tested twice (13 and 26 May).

Just on May 13 becomes the new resistance that must now beat the market over 32.500 points.
It is also important to note that the IPC has established very strong support in the 30,000 points, which has been tested on 4 occasions (marked with numbers in the chart.)

The MACD indicator shows that it is breaking its moving average, which is a positive sign (yellow circle in the figure). Furthermore, the RSI and Stochastic are on the rise and have room for a recovery.

The Mexican market (IPC) shows advance in their movements compare to the Dow Jones 30 Industrials (DJI), for a couple of days. But do not set a trend. Trends are first confirmed by the U.S. market.

Supposedly emerging markets will drive the global economy during 2010, led by China. On the other hand the risks come from the old world (Europe), but the fundamentals in emerging countries have not been affected yet. In such a way that Mexico is in the package of so-called emerging.

In this sense, Mexico has been tempered (softened) his movements in this correction and began to recover strongly. But DJI did yesterday a pullback to validate the break of their bear channel and Mexico still does not validate the breakup.

Attention, tomorrow, Friday 28 IPC could face the resistance in 32.500, if the trend continues. Or can pullback to validate their breakup. The first scenario is most likely.


IPC Index

The most important and representative index for the BMV (MSE) Mexican Stock Exchange is the IPC Index (Indice de Precios y Cotizaciones, translates, Index of Prices and Quotes).

It is the Mexican equivalent (keeping the proportions) of the Dow Jones Industrials 30.

The number of constituents that make up the sample is 35 series, which vary according to certain criteria.

The compositon of the IPC index:  http://mexicostockexchange.blogspot.com/p/ipc_27.html


Another blog that can be interesting.

For those interested in the Mexican market and can read Spanish, I have another blog who might be interested. "Aquí, en mi casa, de bolsa" (It's a play of words in Spanish, but is a stock market blog).

I understand that many readers of this blog do not live in Mexico. I do. If you want to read about an specific topic please ask by mail.


How does behave the Mexican stock market?

The Mexican market has a behavior intimately linked with the behavior of the United States market, specifically the Dow Jones Industrials 30 (although it is also important to follow the S&P 500).

The BMV (acronyms mean -MSE- Mexican Stock Exchange) follow the U.S. market over the medium term:
a) In cases presented detached market movements, over the medium term, however, movements are corrected.
b) The only factor that affects and creates differences is the currency exchange rate.

The reasons for this are:
a) The Mexican economy is dependent on the U.S.. The Mexican domestic market is irrelevant in economic terms.
b) Large Mexican companies traded on both markets.
c) These companies are usually international, then their movements (fundamentals) are global.
d) The size of the mexican market is much smaller than the U.S., which makes their movements affect the mexican market.

So. Why this blog? Do not just watch the DJI?
a) Not all companies behave as the market average, as in the United States.
b) Mexico is part of the emerging countries themselves will play an important role in the global economy and sometimes will broke away from the industrialized economies.
c) Mexico's economy is fragile and dependent on the United States, so that sometimes magnify the consequences of their movements.
d) Mexico stock market has repeatedly been a better alternative to invest than the United States stock market.

Welcome


On the web there are a lot of information about securities and the U.S. market. There is a little less market information of the major economies of the world, however you can find specialized forums and comments from several analysts. However there is a striking lack of information on emerging markets like Mexico.

My personal experience is that there are a lot of information and tools (charts) on the shares, stocks, ETF's, etc. listed in New York, so that I have the elements needed for good analysis and above all, very important, to follow up.

But in Mexico, information is sold, there are few sources, often incorrect and almost no tools for analysis and monitoring. So that is easier to analyze the U.S. market that the Mexican, said by a Mexican operating in Mexico!

Given the importance that this year will have emerging markets, where it is sorted Mexico, despite its bad governance and mismanagement of the domestic economy. I decided to make a small contribution to the financial markets.

This blog is intended to help the international investor that interests you or have to invest in Mexico. With humility I intend to give my point of view and technical analysis, which I hope it will be helpful.

I apologize in advance if I make a mistake in English is not my native lenguage. For this reason I pretend to post two times per week.

Thank you very much for reading. Regards.