Thank you very much to all readers of this blog. I deeply appreciate all your comments and contributions.
I hope that 2010 has been an excellent year.
And a 2011 full of happiness, health and money (especially). Happy trading.
Happy New Year!!
viernes, 31 de diciembre de 2010
January ¿Bear or Bull? 31 december 2010
This post is dedicated to those who apreciate the historic statistics. (For a share of analyst the statistics are irrelevant because the market moves randomly and the events are independent of the precedent events -Stochastics Calculus-).
I choose the Dow Jones Industrial Average/30 because is the only index that I have the complete data. Also is a very vulgar index, moves similar to the Standard and Poor's 500.
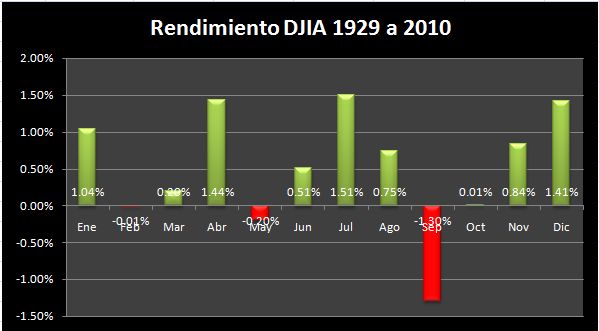
Seasonality. The historical statistics of percentage positive in the years of study.
Long term, january bull.
1929 to 2010
January very bull:
- Seasonality
- Average return

1950 to 2010
Still bull.
- Seasonality
- Averge return


But the mid-term history is very, very different.
2000 to 2010
Still bull.
- Seasonality
- Averge return


2050 to 2010
Very, very bear.
- Seasonality
- Averge return


Other important facts:
1. When december finish positive (like this year), the next january:
1.1 Seasonality 66%
1.2 Average return +0.72%
Maybe, this fact is more meaningful
2. Whne december finish with a return of more of 5% (like this year), the next january:
2.1 Seasonality 70%
2.2 Average return -0.34%
This is very bear.
2.3 In this case is important to see the data:

The Mathematica Expectation is -0.34%. If that was a bet the chances are 3/10 to lose 5%, 7/10 to win 1%, and 1/10 to win 3%. Not very atractive.
Conclusions
If I am a bull:
1. Despite the overall statistics are bull, the last years are very bearish. And you have only 1/3 of chances of wining.
2. The Mathematical Expectation is negative. That is not good.
3. In the last 10 years, january is the worst month of the year.
4. Many bear signals are aligned with a bear statistics: Hindenburg Omen, CPC, VIX:VXV, and others.
5. This week the volume of the market was too low, but if monday the market confirms the signals with a good volume, will be a bad signal. ¿If many investors agree with this numbers will sell on monday? ¿And if the Big Guys sell longs and buy shorts according to the statistics?
If you are bull, take extreme caution in the january trading. Or ¿is time to become a bear?
Other important fact. June the worts month of the year (for bulls, the opposite for the bears) in the long and mid-term. Maybe a good strategy will be mantain liquidity in this month, and maybe, if you like risk and the conditions are good, to buy shorts.
¡¡Happy New Year!!
DJI Seasonality
2. The Mathematical Expectation is negative. That is not good.
3. In the last 10 years, january is the worst month of the year.
4. Many bear signals are aligned with a bear statistics: Hindenburg Omen, CPC, VIX:VXV, and others.
5. This week the volume of the market was too low, but if monday the market confirms the signals with a good volume, will be a bad signal. ¿If many investors agree with this numbers will sell on monday? ¿And if the Big Guys sell longs and buy shorts according to the statistics?
If you are bull, take extreme caution in the january trading. Or ¿is time to become a bear?
Other important fact. June the worts month of the year (for bulls, the opposite for the bears) in the long and mid-term. Maybe a good strategy will be mantain liquidity in this month, and maybe, if you like risk and the conditions are good, to buy shorts.
¡¡Happy New Year!!
martes, 28 de diciembre de 2010
No bear, no bull. December 28, 2010.
Today the markets were bull. As forecasted yesterday.
Only Nasdaq is left behind.
RESULTS
- Dow Jones 11,576 +21 +0.18%
- Nasdaq 2,663 -4 -0.17%
- Standard and Poor's 1,259 +1 +0.08%
- IPC 38,148 +15 +0.04%
INDEXES
IPC
- Little advance. Up, break of the symmetrical triangle? I don't think so. Today most stocks finished in red but the advance of America Movil turns the IPC candle in green.
- Bollinger bands are closing together, this can lead a big move (up or down).
- Oly 30% of the stocks still in overbought. The IPC is neutral so can be up or down in the short time.
- The volume of the IPC is very low, so what happened in these days might be irrelevant.

STANDARD AND POOR'S
- Despite a green candle today, can’t break the 1,260 points resistance. This is not good for the bulls. Not only have the uncertain continued also enable a “triple top” figure, very bearish. So a change in the direction of the trend is possible.
- Observe tomorrow the evolution of this formation.

NASDAQ 100
- In this moment the most important index is the Nasdaq 100, because is facing a very important and strong resistance in the 2,240 points.
- Is very important for the bulls and the rally, that Nasdaq break above 2,240. If bounce in this level maybe a down trend is starting.
- Today the only index that finishes in red was the Nasdaq, detaching from the main trend.

- Today loss force and is marking lower highs, forming something like a symmetrical triangle, maybe the formation is not correct but reflects that the index is not longer in up trend.

DOW JONES
- Dow can’t break the 11,581 level with close, this is not a bull signal.
- The index is not showing bull force, and if not break this level soon, it can confirm the start of a down trend.

VIX
- As commented yesterday, the VIX bounce in the middle of the Bollinger bands. And now directs to the lower band. If this move continues will be good for the bulls and the SPX. See yesterday post.
- Also start to “fill” the GAP that let yesterday in his up.
- VIX:VXV again very low, indicating one more time that maybe a top is near.

PUT TO CALL RATIO
- CPC <= 0.80 indicating, one more time, a top is near.

VOLUME
- But, always a “but”, the today’s volume is very low, again. So everything said above can be wrong. All this signals should be confirmed in a day with volume. See yesterday post.
SEASONALLITY
- Dow Jones 57%
- Standard and Poor's 57%
- Nasdaq 57%
- Tomorrow slightly bull.
- We are in year end Rally (Very bull statistically)
- Las week of the month is 60% bear. (SPX)
- Two trading days of the month are statistically bear (87% for the Standard and Poor's)
- The last day of the year es bear for the Nasdaq 9 of the last 10 times.
CONCLUSIONS
- The short-term and mid-term trends are up.
- Many bear signals accumulated, should mean something. The low volume subtracts technical relevance.
- Neither the bull nor the bears have been imposed.
- Levels to observe:
--- For the bears the supports in:
----- SPX in 1,251
----- Dow in 11,581
----- Nasdaq in 2,240 (The most important level to watch).
--- For the bulls the resistance in 1,260 (SPX)
- The inflow liquidity is also in danger. See “conclusions” in yesterday post.
- For tomorrow my sentiment is slightly bull (Seasonality, year end rally and inflow liquidity).
- Still in “Wait and see” mode.
IPC Sandard and Poors Dow Jones
Report, december 27, 2010. Year end rally in danger?
Monday the markets were bull:
a) Standard and Poor's, Nasdaq and IPC up.
b) The market start low and up all day.
RESULTS
INDEXES
IPC
Friday 24:
- Short day. With low volume.
- Small candle as predicted but the opposite color. During the day el index oscillate between positive and negative, maybe with a half an hour more the candle was green.
- Divergences
- A symmetrical triangle in forming? If so, then observe the break.
- Monday a green candle after three red candles in a row.

Standard and Poor's
- Breaking the ascending channel?
- Losing momentum and force in the up trend.
- If marks a double tops will be a bear signal.

Nasdaq 100
- Possible break of the up channel. If confirmed will be a bear signal.
- Today high is lower than yesterday high, if this pattern continues is bear.

Dow Jones
- The possible rounded top is still valid. Read previous post.
- Sets a support in 1,516. Level to observe.
- Up in long steps but takes a lot of time to grow.
VIX
- Bounce in a very strong support (3+ years long).

- Sometimes VIX bounce at half of Bollingers bands (see pink marks). This time the VIX will search the up band or will bounce down in the middle?
- The bulls have on his side that the VIX let a big GAP that should be filled in short time.
- But the bulls trading range (below 18) was vulnerated (intraday). This is not good for bulls.
- The VIX:VXV again too low, that indicates a top is near.

Put to call ratio
Again CPC<= 0.80 that indicates a top is near. (A repeated signal in the last month).

Bank Index
- Triple top? (Intraday) If so, the target is not too low because the oscillation in price is small, but the most important is that the up trend can change.

Seasonality
- There are a lot of bear signals in absence bull signals.
- But.... always a but... the volume was extremly low, comparable with the november 26th, the friday after Thanksgiving a short day. This is not rare in the year end week.
- The problem is the volume is very importan to validate the Technical Analysis conclusions, without volume we cant form a judgment. Chances are that the prices are distorted and the first day with volume will correct themself.

AIG
- Awesome bull.
- Last wednesday face a big resistence in $56.00, bounce one day and monday break it with impressive force.
- Technical target $68.00 (Two weeks ago looks very far, and today is near).
- Financial Sector very bull in this year end.

Conclusions
- The shor-term and mid-term trend are up.
- Many bear signals appeared. But the volumen was very low subtracting importance. This signals should be confirmed with volume to be valid.
--- For the bears the support in 1,251 (SPX)
--- For the bulls the resistance in 1,260 (SPX)
- The inflow liquidity still high and the sentiment is very bull. I lean towards a bull market.
- But also the inflow liquidity is in danger. The funds need to see good for the clients in the year end, for many managers this implies take profit taking. (Sell).
- For others is the time to take tax-loss, selling "bad" stocks (Sell)
- On the other side is time to take positions for the next year. (Buy)
-- Remember that is institutional operations (The Big Boys themselves).
- For the moment, I'm in "Wait and see" mode.
IPC Sandard and Poors Dow Jones
a) Standard and Poor's, Nasdaq and IPC up.
b) The market start low and up all day.
RESULTS
- Dow Jones 11,555 -18 -0.16%
- Nasdaq 2,667 +2 +0.06%
- Standard and Poor's 1,258 +1 +0.06%
- IPC 38,133 +52 +0.14%
INDEXES
IPC
Friday 24:
- Short day. With low volume.
- Small candle as predicted but the opposite color. During the day el index oscillate between positive and negative, maybe with a half an hour more the candle was green.
- Divergences
- A symmetrical triangle in forming? If so, then observe the break.
- Monday a green candle after three red candles in a row.

Standard and Poor's
- Breaking the ascending channel?
- Losing momentum and force in the up trend.
- If marks a double tops will be a bear signal.

Nasdaq 100
- Possible break of the up channel. If confirmed will be a bear signal.
- Today high is lower than yesterday high, if this pattern continues is bear.

Dow Jones
- The possible rounded top is still valid. Read previous post.
- Sets a support in 1,516. Level to observe.
- Up in long steps but takes a lot of time to grow.

VIX
- Bounce in a very strong support (3+ years long).

- Sometimes VIX bounce at half of Bollingers bands (see pink marks). This time the VIX will search the up band or will bounce down in the middle?
- The bulls have on his side that the VIX let a big GAP that should be filled in short time.
- But the bulls trading range (below 18) was vulnerated (intraday). This is not good for bulls.
- The VIX:VXV again too low, that indicates a top is near.

Put to call ratio
Again CPC<= 0.80 that indicates a top is near. (A repeated signal in the last month).

Bank Index
- Triple top? (Intraday) If so, the target is not too low because the oscillation in price is small, but the most important is that the up trend can change.

Seasonality
- Dow Jones 86%
- Standard and Poor's 76%
- Nasdaq 76%
- Tomorrow ver bull.
- We are in year end Rally (Very bull statistically)
- Standard and Poor's 76%
- Nasdaq 76%
- Tomorrow ver bull.
- We are in year end Rally (Very bull statistically)
- Las week of the month is 60% bear. (SPX)
- Two trading days of the month are statistically bear (87% for the Standard and Poor's)
- The last day of the year es bear for the Nasdaq 9 of the last 10 times.
- Wich statistics will win?
Volume
- There are a lot of bear signals in absence bull signals.
- But.... always a but... the volume was extremly low, comparable with the november 26th, the friday after Thanksgiving a short day. This is not rare in the year end week.
- The problem is the volume is very importan to validate the Technical Analysis conclusions, without volume we cant form a judgment. Chances are that the prices are distorted and the first day with volume will correct themself.

AIG
- Awesome bull.
- Last wednesday face a big resistence in $56.00, bounce one day and monday break it with impressive force.
- Technical target $68.00 (Two weeks ago looks very far, and today is near).
- Financial Sector very bull in this year end.

Conclusions
- The shor-term and mid-term trend are up.
- Many bear signals appeared. But the volumen was very low subtracting importance. This signals should be confirmed with volume to be valid.
- Neither the bull nor the bears have been imposed.
- Levels to observe:--- For the bears the support in 1,251 (SPX)
--- For the bulls the resistance in 1,260 (SPX)
- The inflow liquidity still high and the sentiment is very bull. I lean towards a bull market.
- But also the inflow liquidity is in danger. The funds need to see good for the clients in the year end, for many managers this implies take profit taking. (Sell).
- For others is the time to take tax-loss, selling "bad" stocks (Sell)
- On the other side is time to take positions for the next year. (Buy)
-- Remember that is institutional operations (The Big Boys themselves).
- For the moment, I'm in "Wait and see" mode.
viernes, 24 de diciembre de 2010
December 23th, 2010. Merry Christmas!
The market was bear, against the yesterday forecast and a very bull seasonality.
RESULTS
Today the volumen was low, this fact distorts the market because for the Big Guys is very expensive sell or bought big amounts. Also the bears faces expensive tradings as result of the low volume.
The U.S. Market weak despite the good economic data and the seasonality. ¿Are the bear winning?
RESULTS
- Dow Jones 11,573 +14 +0.12%
- Nasdaq 2,666 -6 -0.22%
- Standard and Poor's 1,257 -2 -0.16%
- IPC 38,131 -41 -0.11%
Today the volumen was low, this fact distorts the market because for the Big Guys is very expensive sell or bought big amounts. Also the bears faces expensive tradings as result of the low volume.
The U.S. Market weak despite the good economic data and the seasonality. ¿Are the bear winning?
The Indexes
IPC
- Two red candles in a row, not very bull. But the most important thing: The IPC respect the support in 38,000 points.
- Some equities present divergence with the up trend of the IPC (are lagging behind). This equities can be an interesting buy if the market continues up. The consensus is optimistic for the year end.

Standard and Poor's
¿Break of the lower band of the ascending channel? If so, then is a very bear signal. Observe on monday for confirmation.

Nasdaq 100
According to yesterday comments, the Nasdaq search the lower bando of the ascending channel, presenting a technical correction.

Dow Jones
Rounded top? If so, is a very bear signal. It is too early but if the index cotinue the correction can form this pattern. Observe.

VIX
- Sets a support in 16.80. Level respected two times in the last four days.
- The bull trading range is below 18.00, the VIX is very low and is very difficult to fall more. This indicate confidence in the market.
- In the bear side, the VIX:VXV very low again, indicating a high is near.

Conclusions
- The short-term and mid-term trends are up.
- The sentiment is very bull, the drive of this ascending market. Result in a very strong buy.
- The seasonality for the year end is very bullish.
- Many bear signals accumulated. Trade carefully.
Tomorrow the US maket is close. The mexican market operates in a short day (close at 12:00). Very low volume expected and maybe a green candle (but a small one). -For the bears is "expensive" to sell in a low volumen market-.
Merry Christmas!!!
IPC Sandard and Poors Dow Jones
IPC
- Two red candles in a row, not very bull. But the most important thing: The IPC respect the support in 38,000 points.
- Some equities present divergence with the up trend of the IPC (are lagging behind). This equities can be an interesting buy if the market continues up. The consensus is optimistic for the year end.

Standard and Poor's
¿Break of the lower band of the ascending channel? If so, then is a very bear signal. Observe on monday for confirmation.

Nasdaq 100
According to yesterday comments, the Nasdaq search the lower bando of the ascending channel, presenting a technical correction.

Dow Jones
Rounded top? If so, is a very bear signal. It is too early but if the index cotinue the correction can form this pattern. Observe.

VIX
- Sets a support in 16.80. Level respected two times in the last four days.
- The bull trading range is below 18.00, the VIX is very low and is very difficult to fall more. This indicate confidence in the market.
- In the bear side, the VIX:VXV very low again, indicating a high is near.

Conclusions
- The short-term and mid-term trends are up.
- The sentiment is very bull, the drive of this ascending market. Result in a very strong buy.
- The seasonality for the year end is very bullish.
- Many bear signals accumulated. Trade carefully.
Tomorrow the US maket is close. The mexican market operates in a short day (close at 12:00). Very low volume expected and maybe a green candle (but a small one). -For the bears is "expensive" to sell in a low volumen market-.
Merry Christmas!!!
jueves, 23 de diciembre de 2010
The market at close december 22, 2010.
The markets were bull. The IPC (Mexican Market) detachet from N.Y. Presenting a correction.
RESULTS
- Dow Jones 11,560 +26 +0.23%
Today the market presents many confirmation signals of bull season, comented in previous posts.
THE INDEXES
IPC
- Presenting a healty pause in the rally. Only a thirth of the equities remains in overbought.
- Today detached from the mayor international indexes. Taking a pause in his un trend, and giving time to moderate the overbought of many of the equities. In this moment the mexican market has the conditons for a continuation of the up tren.
- The todays red candle respect the support (prior the resistance of the broken trading range).
- A big sell of Cemex, the investor taking profit from a big up of the previous days.
- Remember Technically Target 39,500.

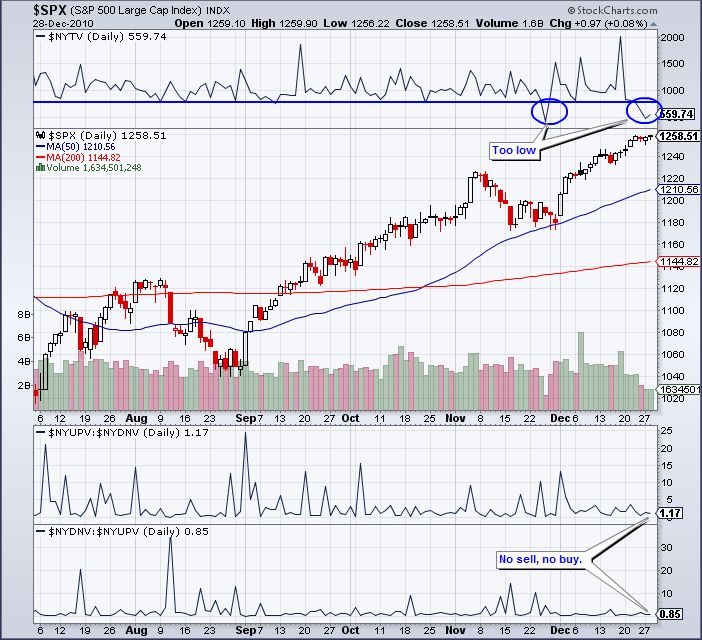
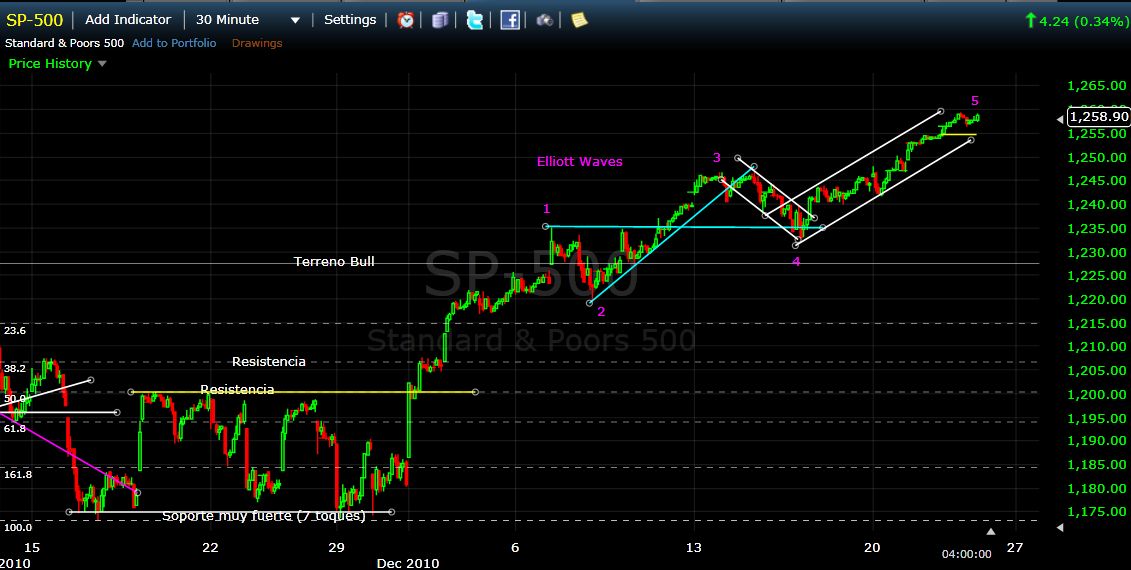
Standard and Poor's
- Moves in an up channel.

- Is in the center of the channel that is good for the up trend. Seems to be the 5th Elliott Wave. This both are good for the bulls. And the index has space for up more.
- Techincally Target 1,335.

Nasdaq
- Also in a up channel. With very high hopes of upgrowth. But is slowing the speed of rise. In the near past was the leading index but not in this momento.
- Is moving in the high part of the channel, enabling a technical correction.

The technical long term picture:

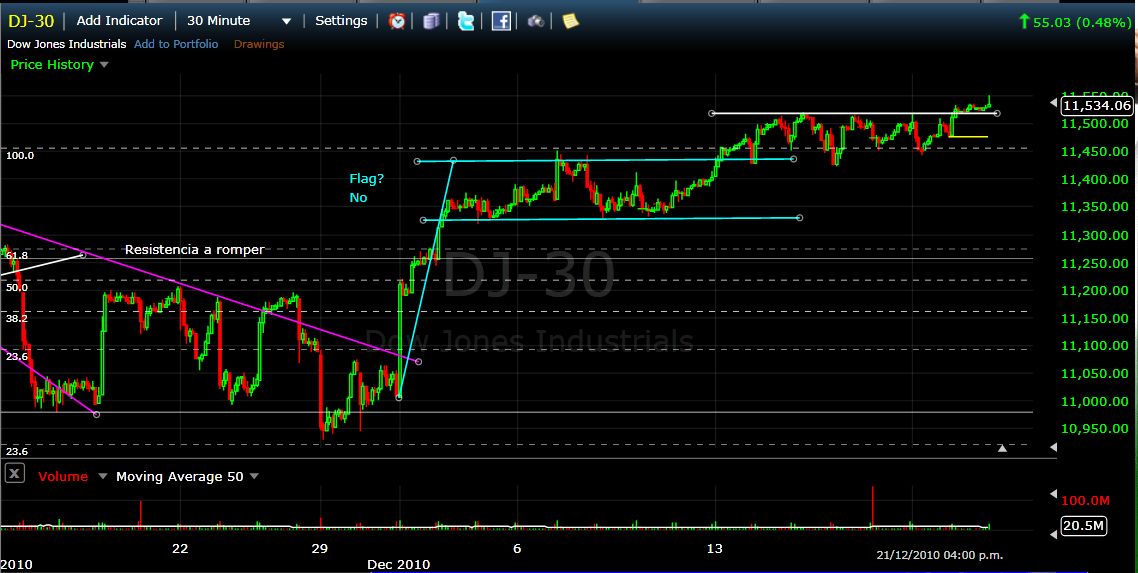
Dow Jones
- Bull but without force and firmness. The most bull part is that has constructed strong supports.

VIX
. The VIX:VXV is very low, in the past this means a "top" is near and a down is comming (could be small or huge).
- Maybe the strong bull sentiment in the market delays this signal, but is accumulating with many others.

Put to Call Ration
- CPCE very low. Indicating a "top" is near. The same as the VIX cumulative bear signals. ¿For the begining of the next year, with a more bear friendly seasonality?

- CPC is also confirming the proximity of the high.

Dolar Euro.
- The Euro is testing a dynamic support. If breaks it, the next suport is in US$1.26. This will not be good for the dolar.

Bank Index
- Resuming his up momentum. Maybe in his 5th up Elliott Wave. Break important resistance.
- If mantains the momentum will be good for the SPX.

AIG
- According to the Bank Index, Have you seen AIG in the past days? Very very bull.
- In this moment testing an important resistance. Maybe a short-term bounce.

- The fiancial sector is very delayed, then the equities have a lot space to grow.
- AIG has a technical target of $68.00 But when?In this rally?

Seasonality
- Christmas week is bull.
- The day before Christmas was bull the last three years.
-Thursday december, 23;
- Dow Jones 71%
- Standard and Poor's 76%
- Nasdaq 81%
-- Bull day.
Market Sentiment
According to Sentimentrader the sentiment of the market is very bull (in levels not seen since december 2006).
Liquidity
- Align with the sentiment of the season, the liquidity is still entering in the market. This is very good for bulls and can override (al lest temporarily) the bear signals. The chart is from Stocktiming.

The investors sentiment for the next year.
The Bespoke readers think the next year will be bull. But expect a modest gain.

Tomorrow NYSE in Holidays.
IPC Sandard and Poors Dow Jones
RESULTS
- Dow Jones 11,560 +26 +0.23%
- Nasdaq 2,671 +4 +0.15%
- Standard and Poor’s 1,259 +4 +0.34%
- IPC 38,173 -58 -0.15%
Today the market presents many confirmation signals of bull season, comented in previous posts.
THE INDEXES
IPC
- Presenting a healty pause in the rally. Only a thirth of the equities remains in overbought.
- Today detached from the mayor international indexes. Taking a pause in his un trend, and giving time to moderate the overbought of many of the equities. In this moment the mexican market has the conditons for a continuation of the up tren.
- The todays red candle respect the support (prior the resistance of the broken trading range).
- A big sell of Cemex, the investor taking profit from a big up of the previous days.
- Remember Technically Target 39,500.

Standard and Poor's
- Moves in an up channel.
- Is in the center of the channel that is good for the up trend. Seems to be the 5th Elliott Wave. This both are good for the bulls. And the index has space for up more.
- Techincally Target 1,335.
Nasdaq
- Also in a up channel. With very high hopes of upgrowth. But is slowing the speed of rise. In the near past was the leading index but not in this momento.
- Is moving in the high part of the channel, enabling a technical correction.

The technical long term picture:

Dow Jones
- Bull but without force and firmness. The most bull part is that has constructed strong supports.
VIX
. The VIX:VXV is very low, in the past this means a "top" is near and a down is comming (could be small or huge).
- Maybe the strong bull sentiment in the market delays this signal, but is accumulating with many others.

Put to Call Ration
- CPCE very low. Indicating a "top" is near. The same as the VIX cumulative bear signals. ¿For the begining of the next year, with a more bear friendly seasonality?

- CPC is also confirming the proximity of the high.

Dolar Euro.
- The Euro is testing a dynamic support. If breaks it, the next suport is in US$1.26. This will not be good for the dolar.

Bank Index
- Resuming his up momentum. Maybe in his 5th up Elliott Wave. Break important resistance.
- If mantains the momentum will be good for the SPX.

AIG
- According to the Bank Index, Have you seen AIG in the past days? Very very bull.
- In this moment testing an important resistance. Maybe a short-term bounce.

- The fiancial sector is very delayed, then the equities have a lot space to grow.
- AIG has a technical target of $68.00 But when?In this rally?

Seasonality
- Christmas week is bull.
- The day before Christmas was bull the last three years.
-Thursday december, 23;
- Dow Jones 71%
- Standard and Poor's 76%
- Nasdaq 81%
-- Bull day.
Market Sentiment
According to Sentimentrader the sentiment of the market is very bull (in levels not seen since december 2006).
Liquidity
- Align with the sentiment of the season, the liquidity is still entering in the market. This is very good for bulls and can override (al lest temporarily) the bear signals. The chart is from Stocktiming.

The investors sentiment for the next year.
The Bespoke readers think the next year will be bull. But expect a modest gain.

Tomorrow NYSE in Holidays.
Conclusions
- The short-term and the mid-term trends are up.
- The sentiment of the market is very bull. The liquidity is still entering in the market and the buy is strong. The seasonality is very bull.
- Many accumulative bear signals: CPC, CPCE, VIX:VXV, Hindenburg Omen, divergences, Overbought, Highs, and many more. Will wait until next year?
Merry Christmas!!!
domingo, 19 de diciembre de 2010
Direction not clear. December 17th, 2010.
Friday the market was bull. Almost all up (Except the Dow).
But the up was very weak, not as expected.
RESULTS.
- Dow Jones 11,492 -7 -0.06%
- Nasdaq 2,643 +6 +0.21%
- Standard and Poor's 1,244 +1 +0.08%
- Gold 1,385 +6 +0.41%
- USD 80.38 +0.36 +0.05%
- IPC 37,997 +165 +0.43%
IPC
Still in lateral channel. Wainting for NY to resolve. Losing a little bit oversold.
Not new news in this index.

The market today
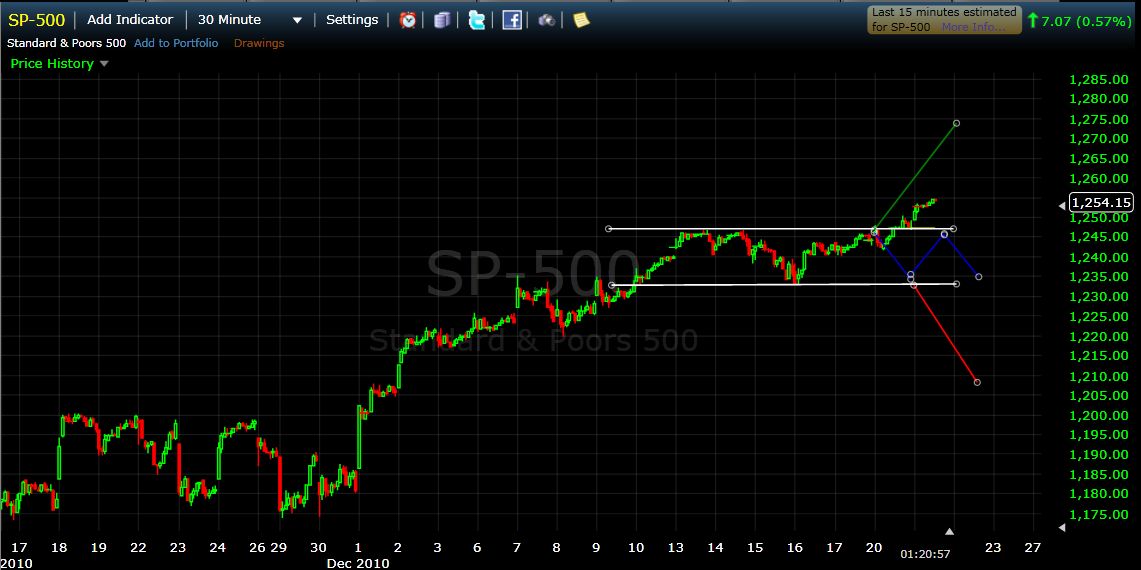
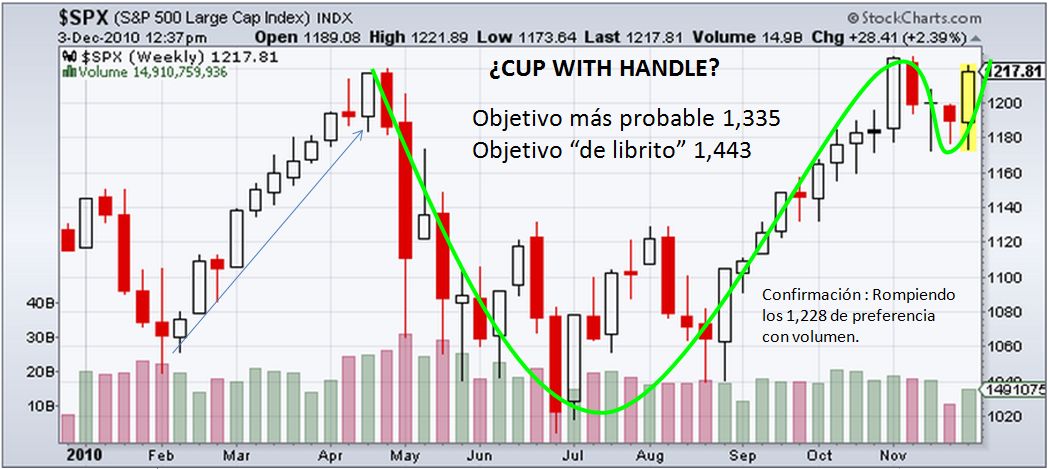
I hope not sound stupid, but the market has three possible paths (SPX):
- Up searching the 1,335 (see, at the end of the post, a chart from december 3th).
- Lateral between 1,247 and 1,233
- Down searching, at least, 1,173.

On the bear side.
a) CPC and CPCE very low for many consecutive days. This should indicate a top near. Post. dec. 15th and dec. 16th.
b) VIX:VXV very low indicating a possible top near. Post. dec. 16th.
c) 7 green candles in a row. Indicating a top near or a very strong trend. (Should be read with other indicators). Post. dec 14th.
d) Highs of 52 weeks very high indicating a possible top near. Also not conclusive but indicates something. Post. dec. 8th.
e) Hindenburg Omen Confirmed. Bear in the mid-term. Post. dec. 15th.
f) You can indentificate many divergences in the indexes.
g) SPX very overbought for many days. This is not conclusive and should be accompanied with other indicators. Chart of Bespoke.


On the bull side.
a) According with Stocktiming the liquidity is still flowing in the market. This override other techincals indicators.

b) The statistics is very bull for year end.
b1.) Next week is short (NY) and tipically the volume is low. This favors the bulls.
b.2) The New Years week has an average profit near 1% and almost 70% positive. (Considering the Dow from 1900 to date.)
b.3) The Christmas week has an average profit of 0.69% and 68% positive. (For reference an average week has a profit of 0.09% and 55% positive).
c) VIX is touching a support but maybe can fall lower (if so is good for the SPX).

The experts
Have for all:
- Deutsche Bank for the bulls.
- Citigroup for the bears.
- UBS for the lateral market.

¿It is clear how complicated is determine the direction of the market in this moment?
CONCLUSIONS
- Wait and see mode.
- For monday slightly bear:
- After a day all up, usually the next day is red (Generally a small red and lonely candle).
- The last day with bear seasonality for the SPX in the year.
Holidays 24th and 31th of december. Next two weeks are short.
Appendix
SPX (Chart from december 3th)
IPC Sandard and Poors Dow Jones
Suscribirse a:
Entradas (Atom)


