a) Standard and Poor's, Nasdaq and IPC up.
b) The market start low and up all day.
RESULTS
INDEXES
IPC
Friday 24:
- Short day. With low volume.
- Small candle as predicted but the opposite color. During the day el index oscillate between positive and negative, maybe with a half an hour more the candle was green.
- Divergences
- A symmetrical triangle in forming? If so, then observe the break.
- Monday a green candle after three red candles in a row.
Standard and Poor's
- Breaking the ascending channel?
- Losing momentum and force in the up trend.
- If marks a double tops will be a bear signal.
Nasdaq 100
- Possible break of the up channel. If confirmed will be a bear signal.
- Today high is lower than yesterday high, if this pattern continues is bear.
Dow Jones
- The possible rounded top is still valid. Read previous post.
- Sets a support in 1,516. Level to observe.
- Up in long steps but takes a lot of time to grow.
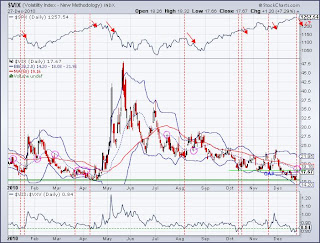
VIX
- Bounce in a very strong support (3+ years long).
- Sometimes VIX bounce at half of Bollingers bands (see pink marks). This time the VIX will search the up band or will bounce down in the middle?
- The bulls have on his side that the VIX let a big GAP that should be filled in short time.
- But the bulls trading range (below 18) was vulnerated (intraday). This is not good for bulls.
- The VIX:VXV again too low, that indicates a top is near.
Put to call ratio
Again CPC<= 0.80 that indicates a top is near. (A repeated signal in the last month).
Bank Index
- Triple top? (Intraday) If so, the target is not too low because the oscillation in price is small, but the most important is that the up trend can change.
Seasonality
- Standard and Poor's 76%
- Nasdaq 76%
- Tomorrow ver bull.
- We are in year end Rally (Very bull statistically)
- There are a lot of bear signals in absence bull signals.
- But.... always a but... the volume was extremly low, comparable with the november 26th, the friday after Thanksgiving a short day. This is not rare in the year end week.
- The problem is the volume is very importan to validate the Technical Analysis conclusions, without volume we cant form a judgment. Chances are that the prices are distorted and the first day with volume will correct themself.
AIG
- Awesome bull.
- Last wednesday face a big resistence in $56.00, bounce one day and monday break it with impressive force.
- Technical target $68.00 (Two weeks ago looks very far, and today is near).
- Financial Sector very bull in this year end.
Conclusions
- The shor-term and mid-term trend are up.
- Many bear signals appeared. But the volumen was very low subtracting importance. This signals should be confirmed with volume to be valid.
--- For the bears the support in 1,251 (SPX)
--- For the bulls the resistance in 1,260 (SPX)
- The inflow liquidity still high and the sentiment is very bull. I lean towards a bull market.
- But also the inflow liquidity is in danger. The funds need to see good for the clients in the year end, for many managers this implies take profit taking. (Sell).
- For others is the time to take tax-loss, selling "bad" stocks (Sell)
- On the other side is time to take positions for the next year. (Buy)
-- Remember that is institutional operations (The Big Boys themselves).
- For the moment, I'm in "Wait and see" mode.


No hay comentarios:
Publicar un comentario